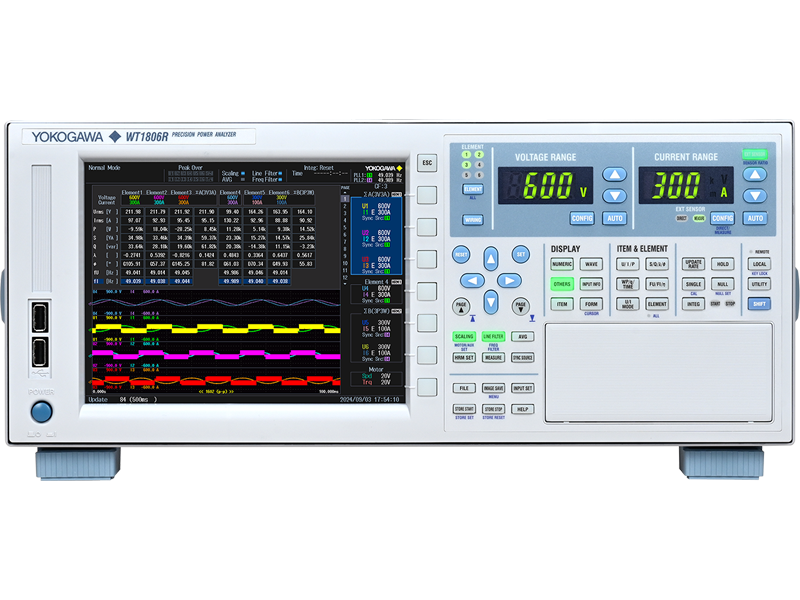
Yokogawa WT1800R – High Performance Power Analyzer
- Sample Rate: 2MS/s
- Power Bandwidth: 0.1Hz-1 MHz
- Resolution: 16 bit
- Elements: 1-6
- Accuracy: 0.05%
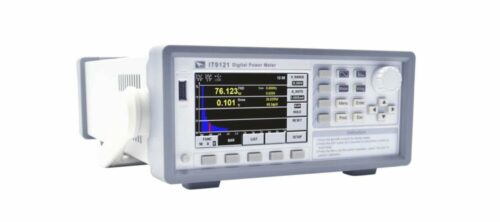
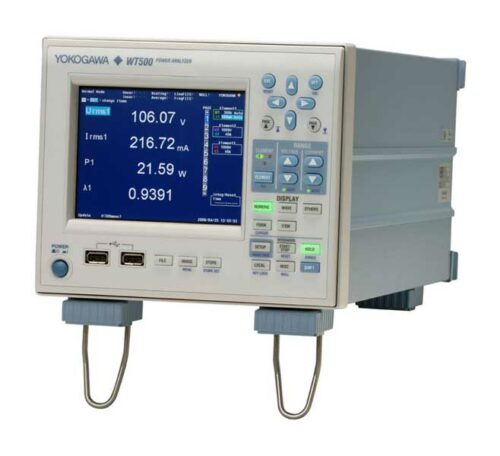
- 8.4″ TFT LCD monitor
- IS8000 Integration with remote control
As the demand for efficient power generation and conversion rises, renewable energy sources like solar and wind are increasingly adopted. Alongside this shift, advances in electric vehicles and energy-efficient technologies make accurate measurements essential to capture even minor energy losses. Whether evaluating multiphase inputs in motor and drive design or meeting strict efficiency standards for photovoltaic inverters, the WT1800R high-performance power analyzer provides engineers with a precise and reliable tool for measuring power, quality, and efficiency.
6 Inputs with High-Resolution Display
Capture simultaneous measurements on up to six inputs at 2 MS/s (16-bit resolution). The WT1800R features an 8.4-inch XGA display that enables split-screen viewing of up to six waveforms, with the capacity to show up to 12 pages of diverse measurement parameters. This setup is ideal for efficiency testing of inverter-driven motors, renewable energy systems, and traction applications such as pumps, fans, and hybrid/electric vehicles. The unit can also display measurements in vector format or trend them over time.
Guaranteed Accuracy Across a Wide Range
The WT1800R ensures accuracy across various voltage, current, and frequency conditions. Basic power (AC) measurement accuracy is maintained between 1% to 110% of the selected voltage and current range, covering voltages from 15 mV to 1100 Vrms and currents from 0.1 mA to 5.5 Arms (5 A input) or 10 mA to 55 Arms (50 A input). The unit’s design minimizes low power factor error, enhancing accuracy during large phase shifts and at high frequencies (±0.07% of apparent power).
Versatile Input Elements
Both 5 A and 50 A input elements can be installed in a single WT1800R unit, allowing engineers to switch seamlessly between different applications, such as standby power measurements and assessing various operating modes of the device under test.
Flexible Data Update Intervals
Choose between 9 data update intervals ranging from 50 ms to 20 s, or enable automatic adjustment based on fluctuating input frequencies—ideal for measurements on motors where frequency varies with RPM. During low-speed operation (input frequency ≤ 20 Hz), updates occur each cycle, which supports monitoring results per motor revolution.
Advanced Harmonic Analysis
Analyze harmonics up to the 500th order for a 50/60 Hz fundamental with a data update interval as fast as 50 ms. The WT1800R includes two harmonic analysis options:
- /G5 Option: Analyzes harmonic components, total harmonic distortion (THD), and fundamental wave.
- /G6 Dual Harmonic Option: Measures harmonics on two sources side-by-side, such as input/output for inverters, motors, lighting ballasts, and UPS.
Comprehensive Motor Evaluation
Beyond electrical parameters, the motor evaluation function captures speed, direction, torque, mechanical power, synchronous speed, slip, electrical angle, motor efficiency, and total system efficiency, using analog or pulse outputs from rotation and torque sensors.
Support for Field-Oriented Control
For permanent magnet synchronous motors (PMSM), commonly controlled with dq-axis parameters, the WT1800R’s enhanced calculation functions compute Ld and Lq, supporting field-oriented control measurements.
DC Power Supply for Current Sensors (/PD2 Option)
Equip the WT1800R with a DC power supply for CT series AC/DC current sensors to measure large currents, enhancing the signal-to-noise ratio and noise immunity.
High-Speed Data Capture
The high-speed data capture function records Sigma-Urms, Sigma-Irms, and Sigma-P from DC and three-phase devices every 5 ms without synchronization, or every 1–100 ms with external synchronization, depending on the clock signal frequency.
Customizable Display and Internal Storage
Customizable screens provide easy parameter confirmation and can be quickly accessed from 1 GB of internal memory, where numerical and other data are also stored.
Correlate Power Consumption and Inverter Waveforms
For motor endurance tests, Yokogawa’s IS8000 software platform synchronizes power data from the WT1800R with waveform data from the DL950 data logger or DLM5000 oscilloscope, enabling efficient on-screen analysis and correlation between power consumption and inverter waveforms.
| Approvals | SPE-1000 |
|---|


